Share this
XYPN completed and released its 2019 Annual Benchmarking Survey at #XYPNLIVE 2019. Now in our third year of the study and sixth year supporting fee-for-service advisors, we are accumulating sound data demonstrating what it takes to launch, grow, and run fee-for-service financial planning firms.
For the annual study, XYPN engages an independent research group, The Ensemble Practice, to collect and analyze data on the following topics: general firm information, firm growth and clients, client services, pricing and fees, technology, and expenses. While over the past three years we have tried to keep the data being collected consistent, we have been evolving how we are reporting and displaying the information. One of the primary changes to this year’s benchmarking study was breaking out the data by business phase: launch, grow, and scale. We define the launch phase as firms in their first 12 months. The grow phase is 13-36 months. The scale phase is defined as firms in existence more than 36 months. The purpose of this segmentation is to provide perspective on how firms compare with others at a similar stage, as well as show how firms’ revenue, client profitability, fees, and services evolve as their firms mature.
This years survey was our most comprehensive yet and shows not only the progression of XYPN firms as they go from launching to scaling, but also how firms have evolved based on their number of years with XY Planning Network.
Here are 5 trends worth noting from the benchmarking survey:
#1. The majority of XYPN Firms met or exceeded their goals in 2018 for revenue, client acquisition, professional development, and business goals. With revenue growth being the top priority in 2019 for of firms.
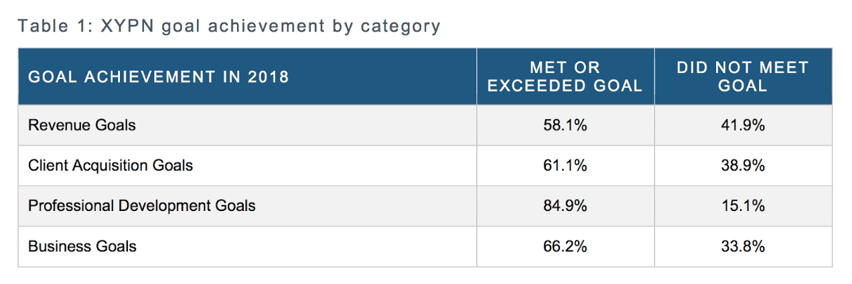
This year, we collected information on current goals, level of satisfaction with progress, and future firm goals. Almost 85% of XYPN firms met or exceeded their professional development goals, while 58% met or exceeded their revenue goals. When we asked about the primary focus for firms in 2019, over 45% indicated it was to grow revenue.
#2. XYPN Firms see significant growth in year 2 after they’ve gotten through launch.
In 2018, XYPN firms grew on average 17.8%. Compared to the S&P 500 which was down 4.38% during the same period, it shows that XYPN firms are able to add revenue through planning and advice despite market headwinds. This data is significant as markets become uncertain, showing there is value in financial planning beyond asset management. The growth numbers become even more compelling segmented by business phase.
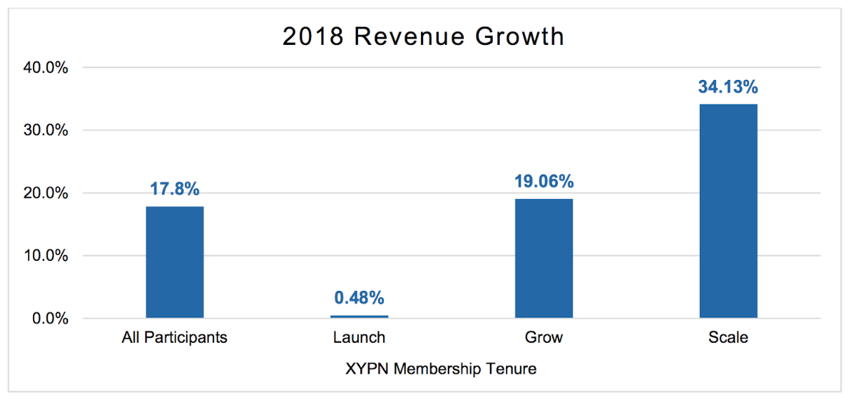
Firms in the launch phase only grew by .48%. However, once they made it through the launch phase and hit the growth phase, they grew by 19.06%. Once firms hit the scaling phase, they grew 34.13% on average in 2018.
It’s no surprise, of course, that launching a firm is hard. At XYPN, we put the emphasis on sales and marketing during the initial launch of your firm, then we use the grow phase to refine services, fees, and processes, so when you hit the scaling phase you have the infrastructure in place to sustain 30% growth.
While growth is a good measurement, ultimately firm profitability is most important. As we look back over the past 2 years of data, firm profitability has increased from 21% to 32.5%. This is a result of firms continuing to grow while becoming more efficient with how they’re delivering their services, and an indication that they are more accurately pricing the services they are delivering.
#3. Having a defined niche for your firm is not only attracting more clients, but also increasing client conversion rates, allowing you to charge higher fees and therefore leading to higher revenue growth and higher firm profitability.
As you know, XYPN routinely preaches the necessity of niching up and this year’s benchmarking data illustrates our point. When we look strictly at revenue growth for firms with a defined niche vs. firms without a defined niche, segmented by business phase, the data tells a compelling story.
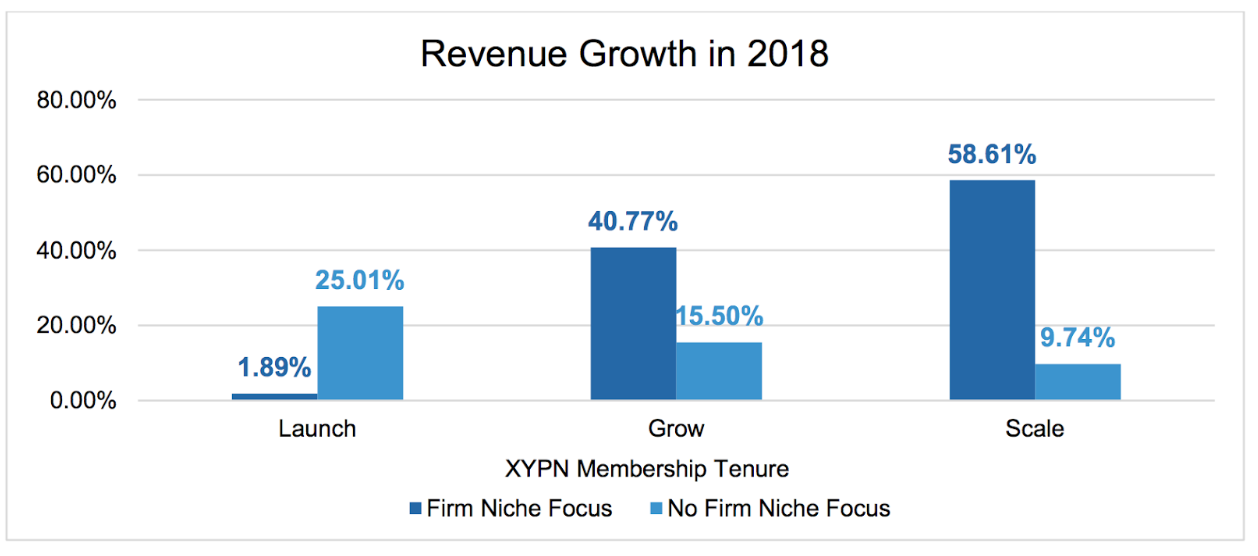
Firms in the launch phase who had a defined niche grew by 1.89% while firms without a defined niche grew 25.01%. This may lead you to believe you shouldn’t focus on a niche while launching a firm. You certainly wouldn’t be the first advisor to take on any client willing to pay you. However, the data shows you’ll want to differentiate before hitting the growth phase where niching up pays off. At this stage, niche firms grow by an average of 40.77% vs. 15.5% for non-niche firms. This gap continues to grow as firms enter the scaling phase with niche-focused firms growing 58.61% vs. non-niche firms at 9.74%.
While identifying and developing a niche may take more time, the data shows niching up is a key factor driving sustainable growth of a firm. The compound annual growth rate (CAGR) from 2016-2018 also helps illustrate this: firm revenue was over 2.5 times higher for niche-focused firms vs. firms without a niche.
#4. Obtaining the CFP® designation is valuable for long-term business success.
CFP® professionals consistently register higher revenues and charge higher fees. As the financial planning and advice profession continues to evolve, the CFP® designation remains as the education standard for financial planners.
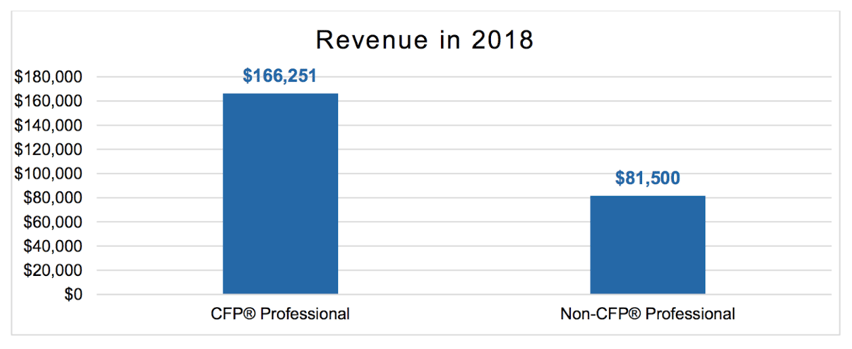
Based on revenue and fee data, advisors with the CFP® designation average more than double the revenue of non-CFP® planners ($166,251 vs. $81,500). In 2018, the highest annual fee paid to CFP® professionals was, on average, more than $5,000 greater than the average top fee paid to non-CFP® professionals.
When we look at these numbers, we conclude that an advisor’s level of expertise increases with with the CFP® designation, allowing him/her/they to charge more. The data may also indicate that clients are looking for advisors who hold this designation.
#5. Despite industry concerns of fee compression, XYPN firms continue to increase fees with a focus on upfront planning fees and ongoing retainer fees.
Fees are one of the most-debated topics at any financial planning event. What type of fees do you charge? Upfront? Retainer? Percent of AUM? How often do you charge?
The study shows that three primary fee structures are commonly utilized among XYPN advisors: retainer, percent of AUM, and stand-alone engagement fees.
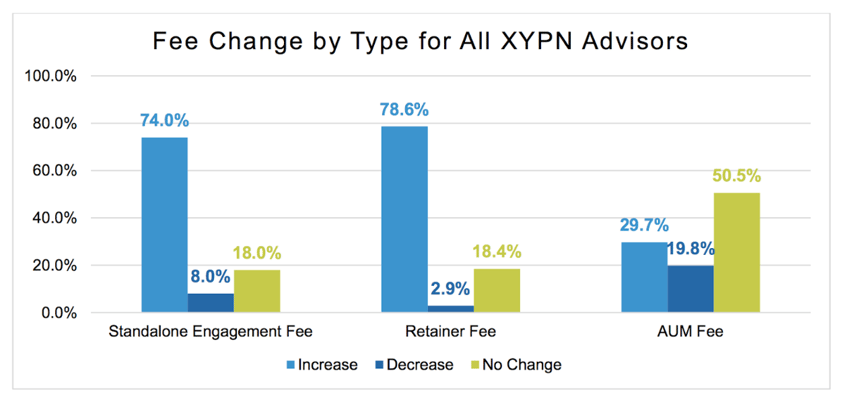
When we take a closer look at these fees, we see that three-quarters of XYPN members have increased their standalone fees and retainer fees, while half of firms have had no change to their AUM fees. These numbers speak to what is happening across the industry. Specifically, firms that lead with planning are less affected by market volatility and are not experiencing the fee compression other financial firms are seeing. Increases in planning and retainer fees are big drivers in increased revenue and profitability of XYPN firms.
These are just a handful of the meaningful takeaways from XYPN’s Annual Benchmarking Study. The study also provides insight on client service models and how they have progressed, more detailed information on what exact fees are being charged for each fee type, and insights into what top-performing firms are doing to accelerate their growth and profitability. Stay tuned for more as we dig deeper into the numbers!

About the Author
As XYPN's Diredvisor Success, Malcolm is tasked with doing just that—helping advisors succeed. After graduating from Gettysburg College with a B.A in Management, Malcolm jumped straight into the financial services industry and never looked back. With a drive to help shape the future of financial planning and a passion for bringing financial advice to the next generation of clients, he has a lot in common with the advisors in the Network.
Share this
Subscribe by email

A Deep Dive Into Fees: Insights From XYPN's Annual Benchmarking Survey

XYPN Radio Roundup: From Broker-Dealer to Fee-Only